




According to Google Search Central, Google introduced a new Generative AI performance report in Search Console in June 2026, giving website owners a way to understand how their pages appear in AI-powered search experiences, including AI Overviews and AI Mode.
If you have logged into Google Search Console recently and noticed a new report sitting quietly under Performance, you are not imagining things. Google has added a dedicated Generative AI report that shows how your website shows up inside AI Mode and AI Overviews. For most site owners, this is the first real window into a part of search that used to be a complete black box.
In this guide, we will walk through exactly how to find this report, what each number actually means, and how to use it to make smarter decisions about your content and your SEO plan. Whether you run the marketing for a single website or manage several client accounts, tracking Google AI Mode traffic in Google Search Console is quickly becoming a basic part of monthly reporting, right alongside clicks and impressions.
What Is the Generative AI Report in Search Console
Google rolled out this report in June 2026, and it lives inside the Performance section of Search Console alongside the reports you already check for Web, Discover, and Video. Its entire purpose is to show how often your pages get pulled into AI-powered answers on Google, specifically AI Overviews and AI Mode.
Here is the part that trips people up. This report only counts impressions. An impression here means a link to one of your pages appeared as a source inside an AI-generated answer, whether or not anyone clicked it. There are no clicks, no click-through rate, and no query data in this report at the moment. Google has been upfront that the report will keep evolving, but as of now, impressions are all you get.
That single fact changes how you should read every chart in this report. A spike in impressions tells you Google’s AI systems are citing your content more often. It does not tell you whether that citation sent a single visitor to your site.

Why This Report Matters Right Now
Search behavior has shifted a lot over the past couple of years. A growing share of searches now end inside an AI-generated summary instead of a traditional list of blue links. If your pages are being used to build those summaries but you have no way to see it, you are flying blind on a big part of your organic visibility.
This report closes that gap, at least partially. It lets you answer questions like which pages are getting picked up by AI Mode, whether that visibility is growing or shrinking month over month, and which countries or devices are driving most of that activity. For a business trying to understand its real search footprint, that is genuinely useful data, even with the missing click numbers.
Step-by-Step: How to Track Google AI Mode Traffic in Google Search Console
Here is the exact process, broken into simple steps.
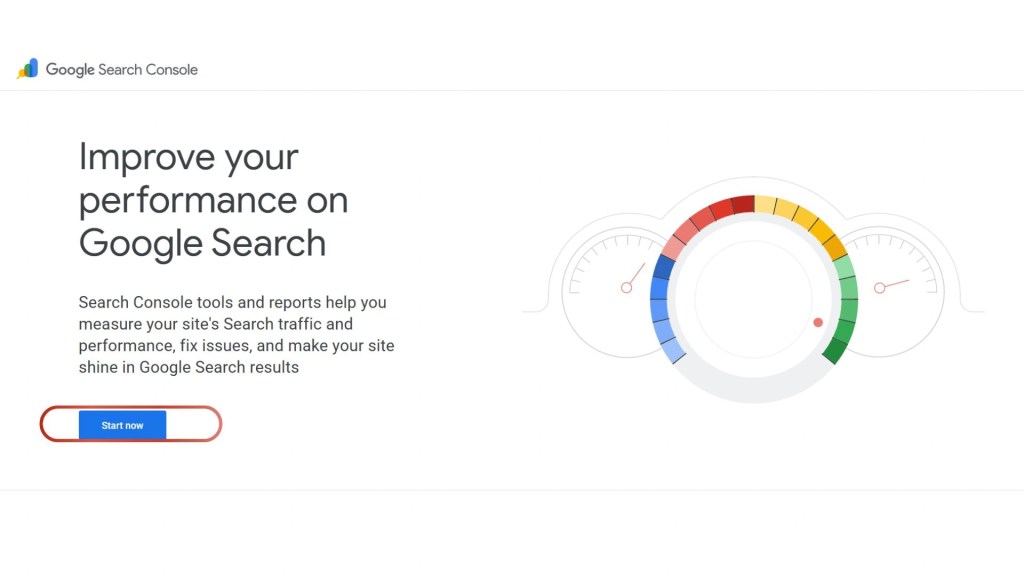
Step 1: Log Into Google Search Console
Go to Search Console and select the property you want to check. If you manage multiple domains or subdirectories, pick the exact property whose AI visibility you want to review, since the report is scoped to whichever property you are viewing.
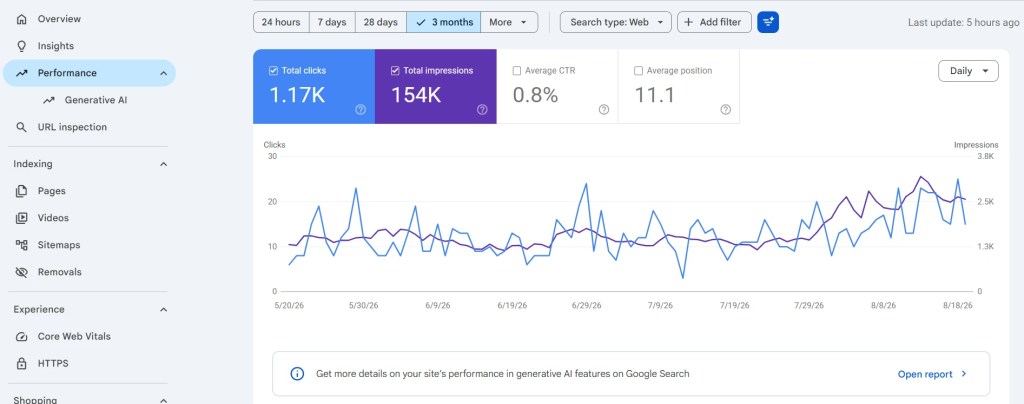
Step 2: Open the Performance Section
In the left sidebar, click on Performance to expand it. You will see the familiar options here, including Web and, depending on your site, Video or Discover.

Step 3: Click Into the Generative AI Report
Under Performance, look for Generative AI in the expanded menu. Click on it to open the report. If you do not see it yet, do not worry. Google is rolling this out gradually, and it also needs a minimum level of AI-related impressions before it will display any data at all. Smaller or newer sites may need to wait a bit longer to see this option appear.

Step 4: Set Your Date Range
Use the date filter at the top, the same one you use for the regular Performance report, to choose your window. You can look at the last 24 hours, 7 days, 28 days, 3 months, or a custom range. For spotting real trends, 3 months is usually the most useful starting point, since day-to-day numbers in this report tend to be small and noisy for most sites.

Step 5: Read the Total Impressions Chart
The main graph shows total impressions over your chosen date range. This is the number of times your pages were shown as a source inside AI Mode or AI Overviews. Watch this line for direction rather than obsessing over daily ups and downs. A slow, steady rise usually means your content strategy is working in AI’s favor.

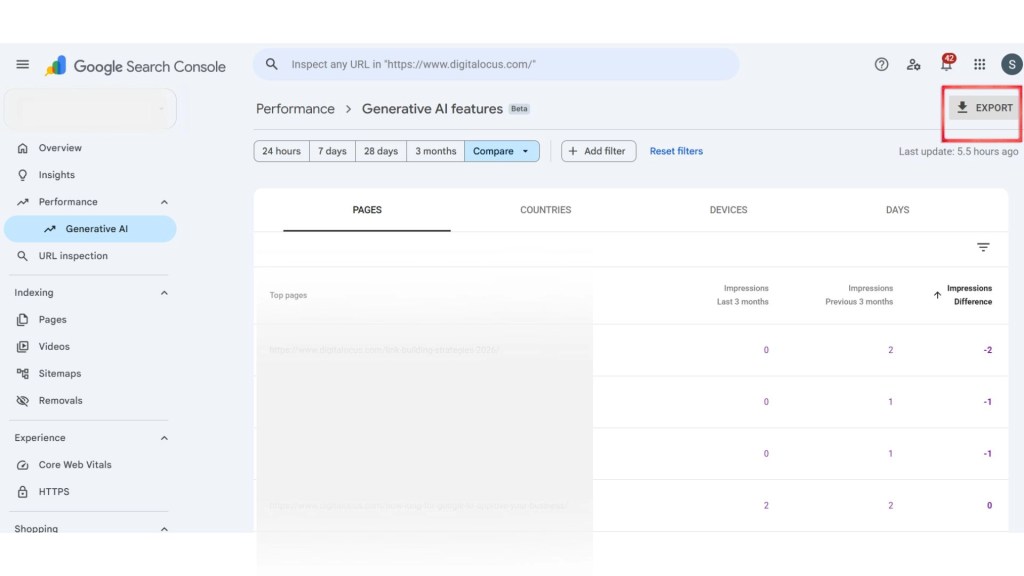
Step 6: Break the Data Down by Pages, Countries, Devices, and Dates
Below the chart, you will find tables you can switch between:
- Pages shows which specific URLs are being cited most often, grouped by canonical URL.
- Countries shows where in the world these impressions are coming from.
- Devices shows the split between desktop, mobile, and tablet.
- Dates shows a day-by-day, week-by-week, or month-by-month breakdown, reported in Pacific Time.
Sort the Pages table first. This tells you which content on your site is doing the heavy lifting when it comes to AI visibility, and it often surprises people. A page that barely shows up in your normal Performance report can be a top performer here.

Step 7: Compare This Report Against Your Regular Performance Report
This is the step most people skip, and it is the one that actually turns this data into insight. Open your standard Web performance report for the same pages and same date range, then compare organic clicks there against AI impressions in the new report.
If a page has strong AI impressions but flat or falling clicks in your regular report, that is a sign AI Mode may be answering the user’s question directly from your content without sending them to your site. That does not mean the page failed. It means the value it delivers has shifted from a click to a citation, and you should factor that into how you judge that page’s performance.
Step 8: Export the Data and Set a Baseline
Export the numbers or drop them into a spreadsheet so you have a clear starting point. Since this is a new report, most site owners do not have historical context yet. Recording your current impressions by page, country, and device gives you something solid to measure future growth against.
Step 9: Check Back Monthly
Add this report to your regular reporting routine. Checking it once and forgetting about it defeats the purpose. A monthly glance, alongside your usual traffic and ranking checks, is enough to catch meaningful shifts early.
What the Report Does Not Tell You
It is worth being honest about the limits here, because a lot of confusion online comes from people expecting this report to behave like the standard Performance report.
It does not show clicks, click-through rate, average position, or the actual queries that triggered your content being cited. There is also a cap on the number of rows shown, similar to the 1,000 row limit in the regular Performance report, and the same general reporting restrictions apply. If your site gets very few AI-related impressions, you may see limited or no data at all for now.
None of this means the report is not worth checking. It just means you should treat it as one piece of a bigger picture, not the whole picture.
How to Get More Out of the Data You Do Have
A few practical habits make this report far more useful than just glancing at a line graph.
Cross-reference with your analytics. Since this report will not show you clicks, keep an eye on your analytics tool for shifts in direct traffic, branded search, or referral patterns around the same pages that show rising AI impressions. Sometimes the click does happen, just a little later and through a different path than a straight search click.
Audit the technical health of your top cited pages. Pages that AI systems pull from tend to be fast, clearly structured, and easy to crawl, with solid use of headings and schema. If a page is showing strong AI impressions, make sure it is not held back by slow load times or messy code. This is exactly the kind of groundwork our SEO services team looks at when auditing a site for both traditional rankings and AI visibility.
Don’t block AI crawlers if you want the visibility. Being cited requires being crawlable. If your robots.txt file is overly restrictive, you are cutting yourself out of this entire channel before you even start.
Keep your site’s foundation solid. A site that loads slowly or has an outdated structure will struggle here just as much as it does in regular search. If your site needs technical work, a proper Website Development Service can rebuild the foundation so both users and AI systems can read your content cleanly.
Think beyond text. AI Overviews and AI Mode increasingly pull in images and video alongside written answers. Original photos, product shots, and short videos give AI systems more material to cite, which is one more reason good visual content, like the kind produced through Commercial Shoot & Production Services, is worth investing in.
Treat this as one channel in a bigger strategy. AI visibility works best alongside a broader presence across search, social, and paid channels. Teams already running Social Media Marketing Services or a Performance Marketing Service often find it easier to spot when AI citations line up with a bump in brand searches or direct visits, because they are already watching the fuller picture of how people find and engage with a brand.
Final Thoughts
How to track Google AI mode traffic in Google Search Console is still a new habit for most marketers, and the report itself will almost certainly keep changing over the coming months. But waiting for a perfect, click-inclusive version before you start paying attention means missing out on real signals available today. Start by finding the report, understand that impressions are the only currency it deals in for now, connect it back to your regular performance data, and build the habit of checking it regularly. That is really all it takes to stay ahead of a shift that is only going to get bigger.
FAQs How to Track Google AI Mode Traffic in Google Search Console
What is the Generative AI report in Google Search Console?
It is a dedicated report under the Performance section that shows how often your website’s pages appear as a cited source inside AI Mode and AI Overviews on Google Search. It currently reports impressions only, broken down by page, country, device, and date.
Where do I find the Generative AI report in Search Console?
Log into Search Console, open the Performance section in the left sidebar, and click Generative AI. If it does not appear yet, your site may not have enough AI-related impressions, or the rollout may not have reached your property.
Does the Generative AI report show clicks from AI Mode?
No. As of now, the report only shows impressions, meaning how often your pages were shown as a source. It does not include clicks, click-through rate, average position, or the search queries that triggered the citation.
Why can’t I see any data in my Generative AI report?
Google is rolling this report out gradually, and it also requires your site to have a minimum level of AI-related impressions before any data appears. Smaller sites or newer properties may not show data yet.
How is this different from the regular Performance report?
The regular Performance report covers all organic Search results, including clicks, impressions, CTR, and average position. The Generative AI report is narrower, covering only impressions from AI Mode and AI Overviews, without click or query-level detail.
Can I use this data to improve my SEO strategy?
Yes. Comparing which pages get cited most often against your regular click data helps you spot where AI answers may be satisfying users without a click, and helps you prioritize technical fixes and content updates for the pages driving the most AI visibility.
How often should I check this report?
A monthly check is usually enough for most sites. Since daily numbers can be small and inconsistent, looking at trends over a 3-month window gives a clearer read on whether your AI visibility is growing.
